 Studies in Informatics and Control – ICI Bucharest
Mean-Variance Models with Missing Data
Marius RADULESCU1, Constanţa Zoie RADULESCU2
1 Institute of Mathematical Statistics and Applied Mathematics
Casa Academiei Romane, 13, Calea 13 Septembrie, 050711 Bucharest 5, Romania mradulescu.csmro@yahoo.com
2 I C I Bucharest
(National Institute for R & D in Informatics)
8-10 Averescu Blvd.
011455 Bucharest 1, Romania
radulescucz@yahoo.com
Abstract: A common challenge in the theory of portfolio selection is that certain assets have shorter return histories than others. Consequently, historical data of the returns have missing data. This paper deals with portfolio selection models of mean-variance type in which missing data exist. Two simple methods for constructing a vector and a matrix starting from a matrix of rate of returns are presented. One considers a standard minimum variance model in which the vector and the matrix built replace the vector of means and the matrix of covariance. Several numerical experiments are made and the effect of missing data on the efficient frontiers associated to the minimum variance models is investigated.
Keywords: Mean-variance model, minimum variance model, missing data, NaN vector of means, NaN covariance matrix.
>>Full text
CITE THIS PAPER AS:
Marius RADULESCU, Constanta Zoie RADULESCU, Mean-Variance Models with Missing Data, Studies in Informatics and Control, ISSN 1220-1766, vol. 22 (4), pp. 299-306, 2013. https://doi.org/10.24846/v22i4y201305
- Introduction
The last decades witnessed a growing amount of attention given to the topic of missing data. Several research papers and books were written on this important subject. Most PhD students in Statistics now claim “missing data” as an area of interest or expertise. Missing data are important to consider, because they may lead to substantial biases in analyses. On the other hand, missing data is often harmless beyond reducing statistical power.
For a complete treatment of the issue of missing data the books written by Little and Rubin [5] and Schafer [15] are excellent choices. A shorter treatment can be found in Allison [1] and a gentle one in McNight et al [8]. Perhaps the nicest treatment of modern approaches can be found in Barladi & Enders [2].
There are some traditional treatments for missing data. The simplest approach is called listwise deletion or complete case analysis. It consists in deleting those cases with missing data and continuing analyses on what remains. For example if we want to compute the arithmetic mean of n numbers a1, a2, …, an but only the numbers ai1, ai2, …, aik are known then we shall consider that the arithmetic mean of the numbers a1, a2, …, an is equal to
![]()
Another simple approach is to replace all missing data with the arithmetic mean of all known data. If aj1, aj2, …, ajn-k are the unknown terms of the sequence a1, a2, …, an we shall aj1 = aj2 = … ajn-k = m. Then one can easily note that the arithmetic mean of the numbers a1, a2, …, an is equal to m.
Although the listwise deletion approach often is applied for analyses with small sample size, it does have important advantages. In particular, under the assumption that data are missing completely at random, it leads to unbiased parameter estimates.
Other simple methods for treatment are: pairwise deletion, mean substitution, averaging the available variables, regression-based single imputation. Recommended methods for handling missing data fall into two general categories: model-based procedures and data-based procedures. Model-based approaches rewrite the statistical algorithms so as to handle the missing data and estimate parameters all in a single step. Data-based approaches, on the other hand, handle the missing data in one step, and then perform the parameter estimation in a second, distinct, step.
Software modules for handling problems with missing data are included in the following software packages: IBM SPSS, SAS STAT, MATLAB, SOLAS, AMELIA.
The IBM SPSS Missing Values software may be used by survey researchers, social scientists, data miners, market researchers and others to validate data. It uses statistical algorithms and allows the users to examine data, to uncover missing data patterns, then to estimate summary statistics and to impute missing values. The SPSS Missing Values software allows the imputation of missing data, draw valid conclusions and remove hidden bias. It quickly diagnose missing data imputation problems using diagnostic reports, it replaces missing data values with estimates using a multiple imputation model, display and analyze patterns to gain insight and improve data management.
SAS STAT® software offers the MI and MIANALYZE procedures for creating and analyzing multiply imputed data sets for incomplete multivariate data. Multiple imputation provides a useful strategy for dealing with data sets with missing values. Instead of filling in a single value for each missing value, multiple imputation procedure (Rubin [13]) replaces each missing value with a set of plausible values that represent the uncertainty about the right value to impute.
These multiply imputed data sets are then analyzed by using standard procedures for complete data and combining the results from this analysis. No matter which complete-data analysis is used, the process of combining results from different imputed data sets is essentially the same. This results in statistically valid inferences that properly reflect the uncertainty due to missing values.
The representation of missing or unavailable data values in MATLAB® code is made with the special value, NaN which stands for Not-a-Number. When the data is plotted on a time-plot that contains missing values, gaps appear on the plot where missing data exists. In order to estimate missing values one can use the command misdata. This command linearly interpolates missing values to estimate the first model. Then, it uses this model to estimate the missing data as parameters by minimizing the output prediction errors obtained from the reconstructed data. The model structure is specified by the user in the argument of the command misdate. Alternatively a default-order model using the n4sid method will be estimated.
An interesting paper which contains a survey on the software for missing data is Hox [3]. A study of the efficient frontier of portfolio selection models with missing data, using MATLAB can be found in Taylor [14].
In our paper we show that to each matrix R containing missing data one corresponds a binary matrix B having the same dimension with the matrix R, that describes the location of missing data in the matrix R. Thus the arrays of matrix B are equal to zero in the corresponding location of matrix R where there is a missing data and are equal to one where in the corresponding location of matrix R there exist an array whose value is known.
Vice-versa if we have a complete matrix R (that is all its arrays are known values) and a binary matrix B having the same dimension with the matrix R then we can treat the matrix R as a matrix with missing data, the locations of missing data in matrix R being those corresponding to the locations where the arrays of matrix B are equal to zero. Two simple methods for constructing a vector and a matrix starting from a matrix of rate of returns are presented. The vector and the matrix built will replace the vector of means and the matrix of covariance in a standard minimum variance model. Several experiments are made and the effect of missing data on the efficient frontiers associated to the minimum variance models is investigated. The purpose of the paper is to consider some numerical examples in order to show how diverse, the impact of increasing the proportions of missing data, on efficient frontiers can be.
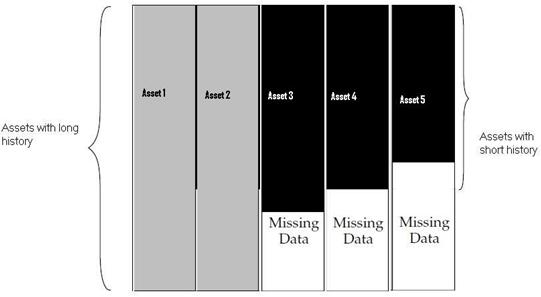 Figure 1. Assets with various rate of return history
REFERENCES
- ALLISON, P. D., Missing Data, Thousand Oaks, CA: Sage Publications, 2001.
- BARLADI, A. N., C. K. ENDERS, An Introduction to Modern Missing Data Analyses. Journal of School Psychology, vol. 48, 2010, pp. 5-37.
- HOX, J. J., A Review of Current Software for Handling Missing Data, Kwantitatieve Methoden, vol. 62, 1999, pp. 123-138.
- LEDOIT O., M. WOLF, Improved Estimation of the Covariance Matrix of Stock Returns with an Application to Portfolio Selection, Journal of Empirical Finance no.10, 2003, pp. 603-621.
- LITTLE, R. J. A., D. B. RUBIN, Statistical Analysis with Missing Data, New York, Wiley, 1987.
- MARKOWITZ, H. M., Portfolio Selection, Journal of Finance. vol. 7, 1952, pp. 77-91.
- MARKOWITZ, H. M., Portfolio Selection. Efficient Diversification of Investments. John Wiley & Sons, Inc., New York, 1959.
- MCKNIGHT, P. E., K. M. MCKNIGHT, S. SIDANI, A. J. FIGUEREDO, Missing Data: A Gentle Introduction, Guilford Press, New York. 2007.
- PAGE, S., How to Combine Long and Short Return Histories Efficiently, Financial Analysts J., Vol. 69, no. 1, 2013, 45-52.
- RĂDULESCU, M., C. Z. RĂDULESCU, M. TUREK RAHOVEANU, G. ZBĂGANU, A Portfolio Theory Approach to Fishery Management, Studies in Informatics and Control, vol. 19(3), 2010, pp. 285-294.
- RĂDULESCU M., C. Z. RĂDULESCU, M. TUREK RAHOVEANU, Safety-first and Chance-constrained Production Planning Models for Fish Farms, 11th WSEAS International Conference on Systems Theory and Scientific Computation (ISTASC 2011), Florence, Italy, (2011), pp. 199-204.
- RĂDULESCU, C. Z., M. RĂDULESCU, A Decision Support Tool Based on a Portfolio Selection Model for Crop Planning under Risk, Studies in Informatics and Control, vol. 21(4), 2012, pp. 377-382.
- RUBIN, D. B., Multiple Imputation for Nonresponse in Surveys, New York: John Wiley & Sons, Inc., 1987.
- TAYLOR B., Developing Portfolio Optimization Models, http://www.mathworks.com/company/newsletters/articles/developing-portfolio-optimization-models.html
- SCHAFER, J. L., Analysis of Incomplete Multivariate Data, New York: Chapman and Hall, 1997.